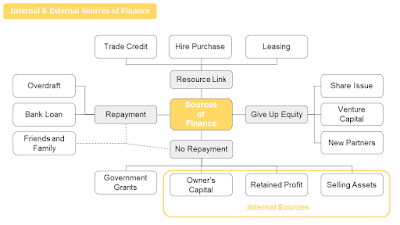
In excited support of the release of the fabulous new book ‘Organise Ideas’ from Oliver Caviglioli and David Goodwin, I am sharing some of the various ways I have used word diagrams in my own practice. I hope these posts will be of particular use to teachers of economics and business, but also more widely!
----------------------------------------------------
I love the topic of 'sources of finances' in Business, but it is seriously unwieldy! Teaching a seemingly endless list of sources and their accompanying lists of advantages and disadvantages has been attempted by me in a numerous sub-optimal (sorry! I was really trying, it's hard!) ways over the years unfortunately.
The decision to try and bring order to the boredom/chaos/overload by attempting to design a diagram to support my teaching of the key ideas has significantly improved the situation though!
Avoiding Mapshock
Presenting an entire diagram at once can be overwhelming for the learner, so I present this one gradually, using a series of slides, to slowly reveal the story of the various financial options.
I start by verbally creating an imaginary business scenario with the class where finance is required.
Next, I hand out copies of the diagram with empty boxes (first image below) for students to write on.
I then gradually introduce the categories I have created and each of the possible sources, one by one, and discuss them in relation to the scenario. I remember (mostly!!) to pause and remain quiet whilst students copy down just the name of each one as we go.
Having covered all of the sources (with my verbal scenario narrative), we can then progress to examining further different scenarios and explore the advantages and disadvantages in more depth (often using the grey 'category' words to help). Written models and practice follows.
In future lessons I provide the blank initial empty diagram for completion as a retrieval task. Later retrieval opportunities will just involve plain paper.
Other Examples
I take the same approach as outlined here with teaching of most complex diagrams that I use in both business and economics (see the diagram on contestability for example here ).
You can see here a You Tube video I have created for the diagram below on the marketing topic of 'Product'. Again, I have found that using a diagram brings coherence to a previously disorderly topic, which supports clear instruction and improved retrieval. Using video in particular has really helped with this type of diagram (do watch and I think you will see what I mean) and in supporting students' remote learning during lockdowns/self-isolation.


Comments
Post a Comment